

CSAT measures how satisfied a customer is with one specific thing, such as an order or a support reply. NPS measures how likely they are to recommend your business as a whole. CSAT is the share of customers who answer 4 or 5 on a 1 to 5 scale. NPS is the percentage of promoters (9 or 10 on a 0 to 10 scale) minus the percentage of detractors (0 to 6). They answer different questions, so the choice is less "which one" than "which one when".
Use CSAT after an event and NPS for the relationship. Ask a CSAT question one to two weeks after delivery and at the end of a support conversation. Ask the NPS question a few times a year, or after a second order, once the customer knows you. Add a Customer Effort Score (CES) question after checkout or a return if you want to find friction. All three are private scores for your team. None of them replaces a public review, and none should decide who gets invited to write one.
Reviewed by Nicolas Provost, founder of Reviewz.ai. Insights based on auditing 500+ Shopify review setups and analyzing public pricing, schema, and conversion data across the leading review platforms. LinkedIn
CSAT vs NPS at a glance
| CSAT | NPS | CES | |
|---|---|---|---|
| Full name | Customer satisfaction score | Net Promoter Score | Customer Effort Score |
| Question | How satisfied are you with [your order]? | How likely are you to recommend us to a friend or colleague? | How easy was it to [place your order]? |
| Scale | 1 to 5 | 0 to 10 | No single standard (1 to 5 in this article) |
| How it is calculated | Share of answers that are 4 or 5 | % of promoters minus % of detractors | Average answer, or share of "easy" answers |
| Range | 0% to 100% | -100 to +100 | Depends on the scale |
| When to send | Right after a specific event | Periodically, once the customer knows you | Right after a task: checkout, return, support |
| What it tells you | How one interaction or product landed | Loyalty and likely word of mouth | Where customers have to work too hard |
| Main weakness | Not standardized, so hard to compare between companies | One number hides very different customer mixes | Narrow: says nothing about the product or the price |
What CSAT is and how to calculate it
CSAT stands for customer satisfaction score. You ask one question about one thing the customer just experienced, usually on a five-point scale from very unsatisfied to very satisfied. Qualtrics describes it as a metric that "targets a “here and now” reaction to a specific interaction, product, or event" (Qualtrics, What is CSAT).
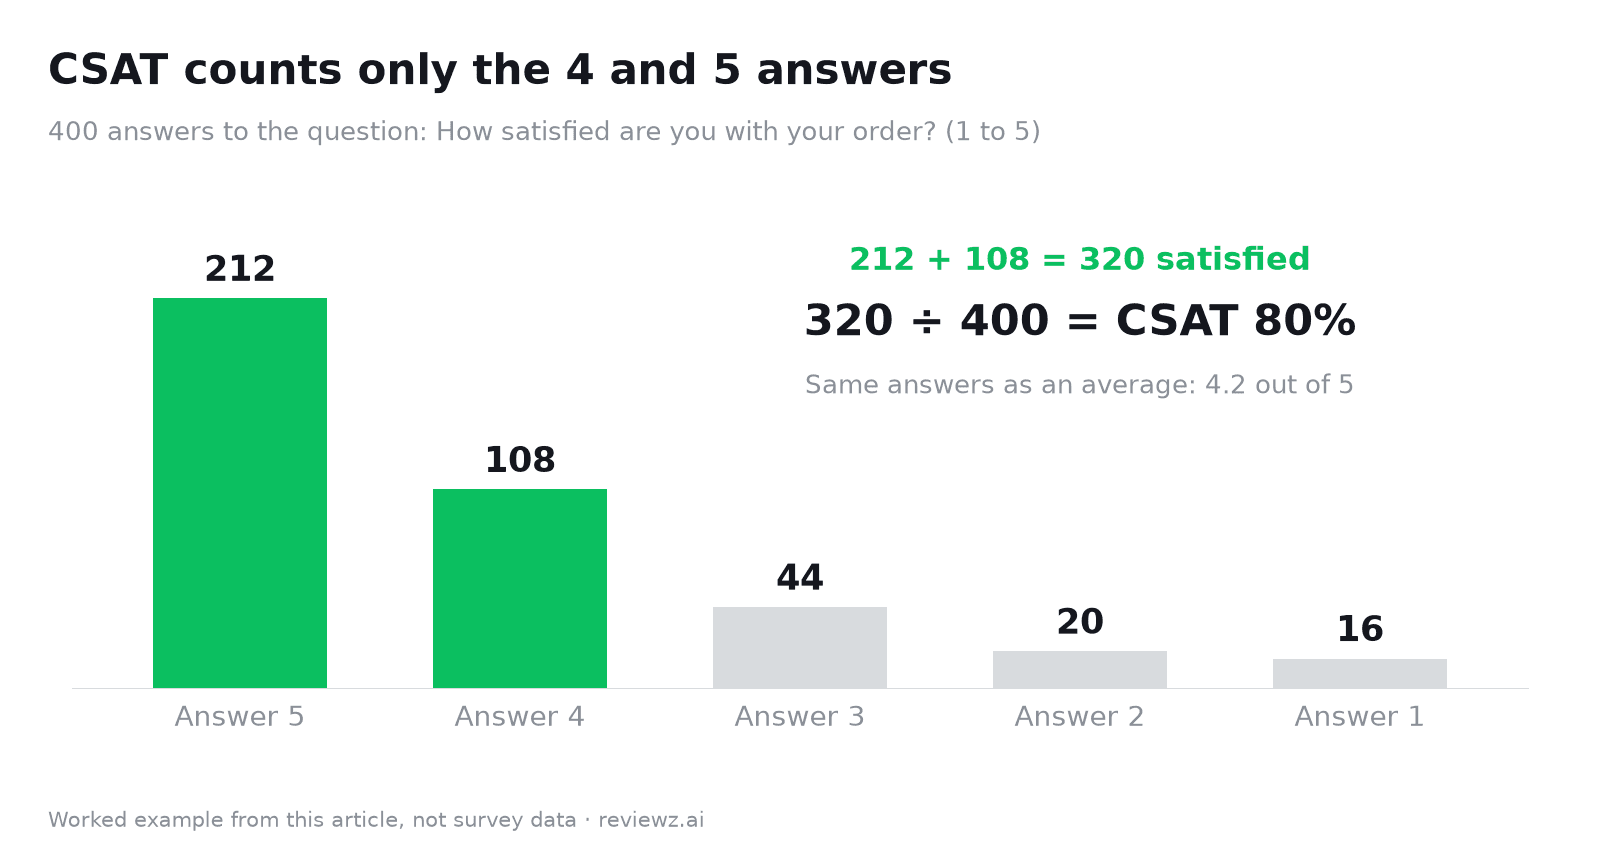
The formula counts only the two top answers:
CSAT = (number of 4 and 5 answers ÷ total number of answers) x 100
Worked example. A store sends "How satisfied are you with your order?" and gets 400 answers:
| Answer | 5 | 4 | 3 | 2 | 1 | Total |
|---|---|---|---|---|---|---|
| Customers | 212 | 108 | 44 | 20 | 16 | 400 |
Satisfied customers: 212 + 108 = 320. CSAT = 320 ÷ 400 x 100 = 80%.
The same answers can be read as an average: (5 x 212 + 4 x 10⁸ + 3 x 44 + 2 x 20 + 1 x 16) ÷ 400 = 1,680 ÷ 400 = 4.2 out of 5. Both readings are legitimate, but they are not interchangeable. Pick one and say which one you report.
Where CSAT is weak. There is no official wording or scale. In a 2020 release on customer experience metrics, Gartner says of CSAT: "The questions are often not standardized making benchmarking difficult." (Gartner) Your CSAT is mainly comparable with your own CSAT last month.
What NPS is and how to calculate it
NPS stands for Net Promoter Score. It was introduced by Frederick F. Reichheld in the Harvard Business Review article The One Number You Need to Grow (December 2003). Bain & Company, one of the holders of the Net Promoter trademarks, publishes the reference definition: ask "How likely are you to recommend us to a friend or colleague?", score the answers on a zero-to-ten scale, and the score "is simply the percentage of customers who are promoters (those who scored 9 or 10) minus the percentage who are detractors (those who scored 0 to 6)" (Bain & Company, Measuring Your Net Promoter Score). Customers who answer 7 or 8 are passives.
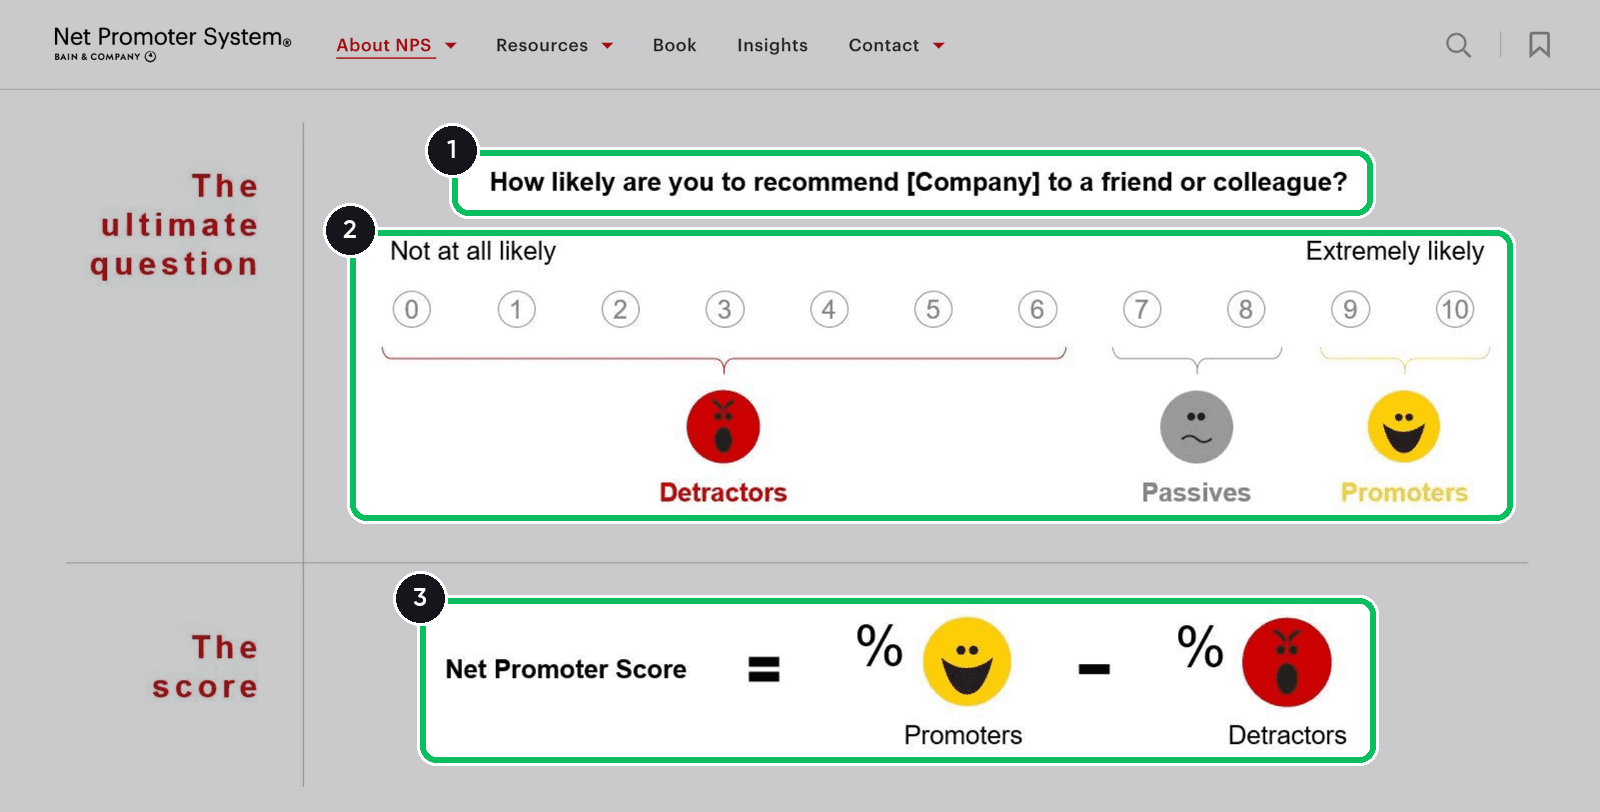
NPS = % of promoters minus % of detractors
The result is a number between -100 and +100, not a percentage.
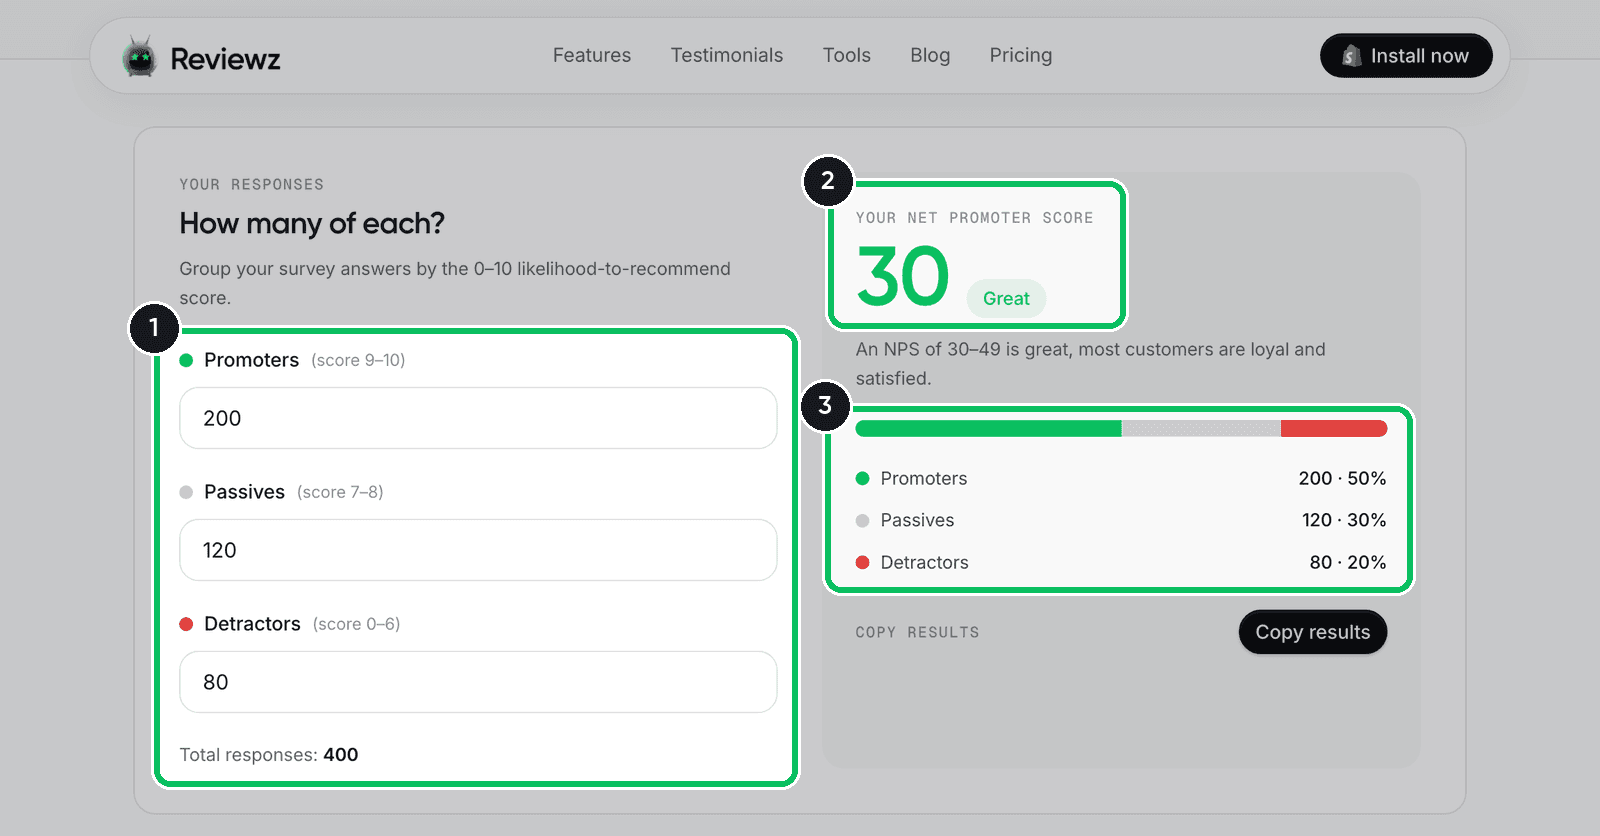
Worked example. The same store asks the recommendation question and gets 400 answers:
| Group | Answers | Customers | Share |
|---|---|---|---|
| Promoters | 9 or 10 | 200 | 50% |
| Passives | 7 or 8 | 120 | 30% |
| Detractors | 0 to 6 | 80 | 20% |
NPS = 50 minus 20 = 30. Passives count in the total but not in the subtraction. To skip the arithmetic, enter the three counts in our free NPS calculator.
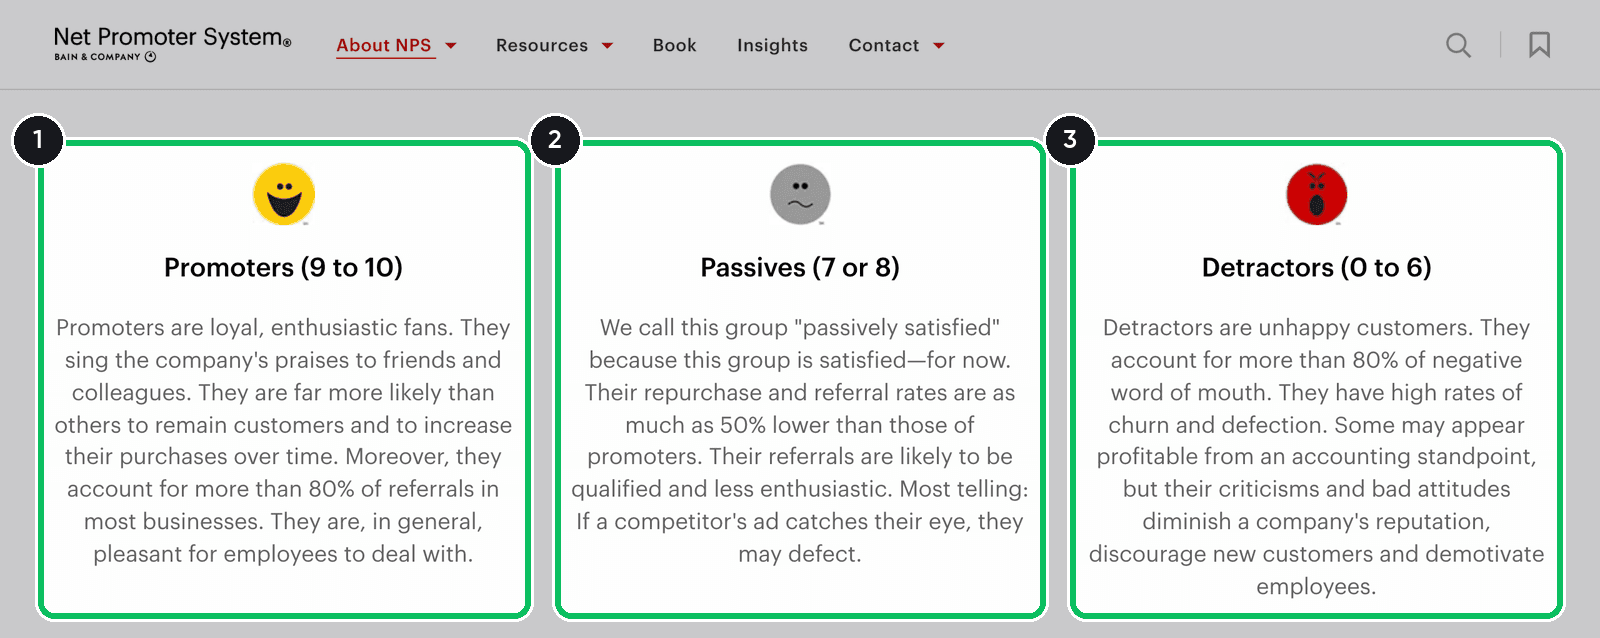
Why the groups matter. According to Bain, promoters "account for more than 80% of referrals in most businesses", detractors "account for more than 80% of negative word of mouth", and the repurchase and referral rates of passives "are as much as 50% lower than those of promoters". That is the logic of the score: it tries to measure future word of mouth, not present satisfaction.
Where NPS is weak. Three limits are worth knowing before you put it on a dashboard.
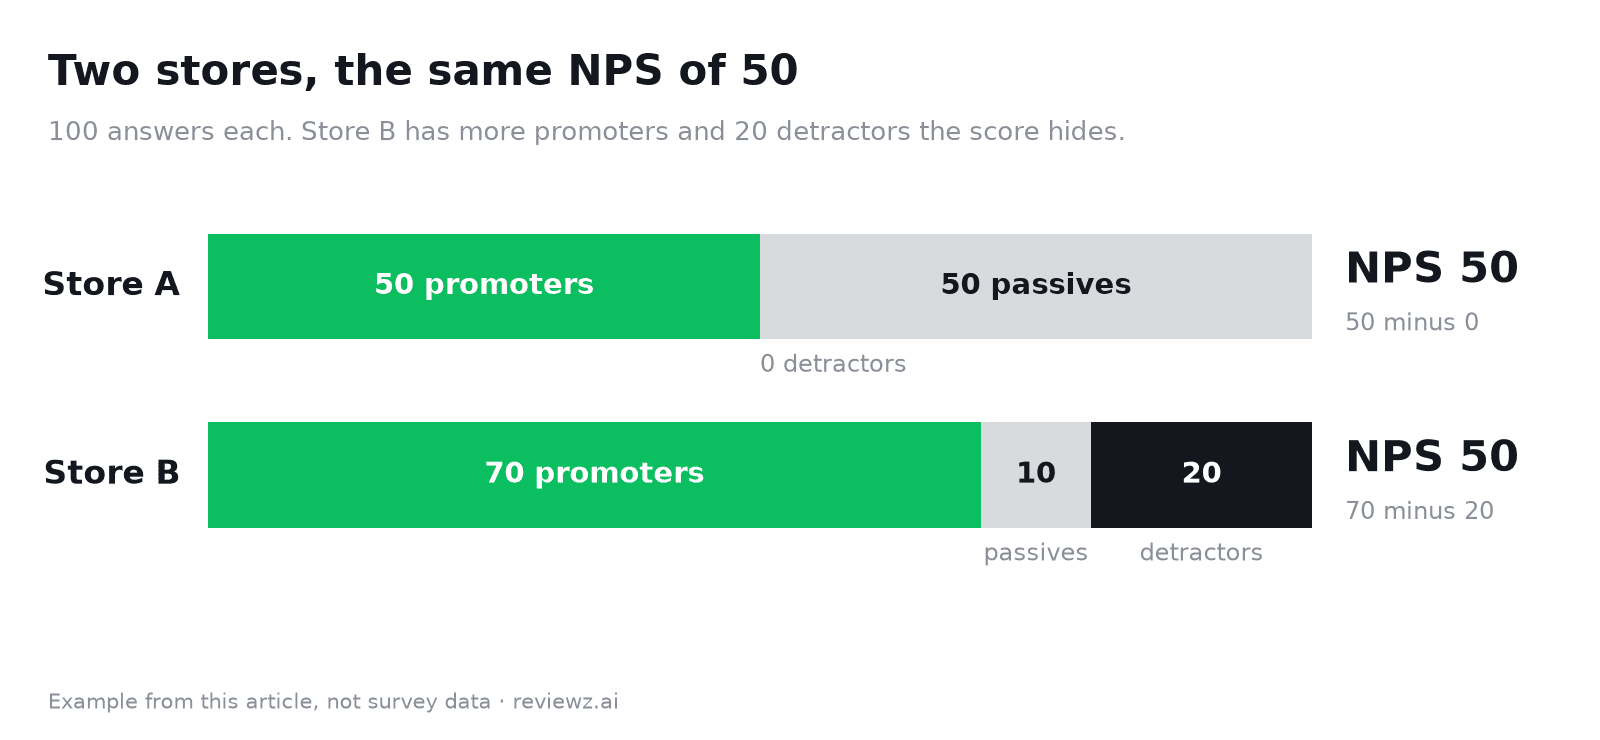
- One score, different stores. Store A has 50 promoters, 50 passives and no detractors out of 100 answers: NPS 50. Store B has 70 promoters, 10 passives and 20 detractors: NPS 50 too. Store B has more fans and a real problem that the single number hides. Always look at the three shares.
- Small samples swing. With 40 answers, one customer who moves from promoter to detractor changes the score by 5 points (one fortieth less on one side, one fortieth more on the other).
- Scores travel badly. The same Gartner release points out that "in EMEA it’s less common to give the highest rating for a satisfying experience than in North or Latin America" (EMEA is Europe, the Middle East and Africa), so one product can produce a different NPS in different regions.
Here is the first of those limits as a picture.
CES, the third score
The Customer Effort Score asks how easy something was. It became popular after the Harvard Business Review article Stop Trying to Delight Your Customers (Matthew Dixon, Karen Freeman and Nick Toman, July-August 2010). Gartner describes it this way: "This score works best in a service environment and measures how easy it is for the customer to do business with an organization, or to handle an issue."
There is no single official scale. A simple version is "How easy was it to get your problem solved?" from 1 (very difficult) to 5 (very easy), reported as an average. With 50 answers split 20, 15, 8, 4 and 3 from 5 down to 1, the average is (100 + 60 + 24 + 8 + 3) ÷ 50 = 3.9, and 35 customers out of 50, or 70%, found it easy.
Use CES where the customer has a task to complete: checkout, a return, an exchange, a support request. It will not tell you whether they like the product.
Which one an online store should use, and when
Match the score to what the customer can judge at that moment.
| Moment | Score | Sample question | Where to ask |
|---|---|---|---|
| Right after checkout | CES | How easy was it to place your order? (1 to 5) | Thank you page |
| One to two weeks after delivery | CSAT | How satisfied are you with your [Product]? (1 to 5) | Email, SMS or WhatsApp |
| End of a support conversation | CSAT or CES | How satisfied are you with the help you received? (1 to 5) | In the same thread |
| After a return or an exchange | CES | How easy was it to return your item? (1 to 5) | |
| Every quarter, or after a second order | NPS | How likely are you to recommend [Store] to a friend or colleague? (0 to 10) |
Three practical rules:
- Do not ask NPS on a first order that has not arrived. The customer cannot recommend what they have not received.
- One score per message. A CSAT question and an NPS question in the same email measure the mood of the moment twice.
- Keep wording, scale and timing fixed. A score is only useful as a trend, and a trend breaks every time you change the question.
Where these messages sit among your other emails is covered in our post-purchase email flow, and the delay after delivery follows the same logic as the best time to send a review request.
NPS survey questions: the one that counts and the follow-ups
An NPS survey is two questions, not ten. The first is fixed. The second depends on the answer, and it is where the useful information is.
| Who | Follow-up question | What you do with it |
|---|---|---|
| Everyone | What is the main reason for your score? | Read every answer, tag the themes |
| Promoters (9 or 10) | What would you tell a friend about us? | Reuse the words on your product pages |
| Passives (7 or 8) | What would have made it a 9 or a 10? | Find the missing piece |
| Detractors (0 to 6) | What went wrong, and how can we fix it? | Open a support conversation the same day |
For CSAT, the follow-up is simply "What is the one thing we could do better?". If you are looking for a longer list of customer satisfaction survey questions, we keep a bank of 32, grouped by goal, in our guide to post-purchase survey questions.
What is a good CSAT or NPS score?
Honest answer: it depends on who publishes the benchmark, how they sampled and which question they asked. We could not find a public, primary NPS benchmark for online stores that we trust, so we are not going to print one. Qualtrics makes the same point about CSAT: "Benchmarking a CSAT score isn’t an exact science, since every business and product is different".
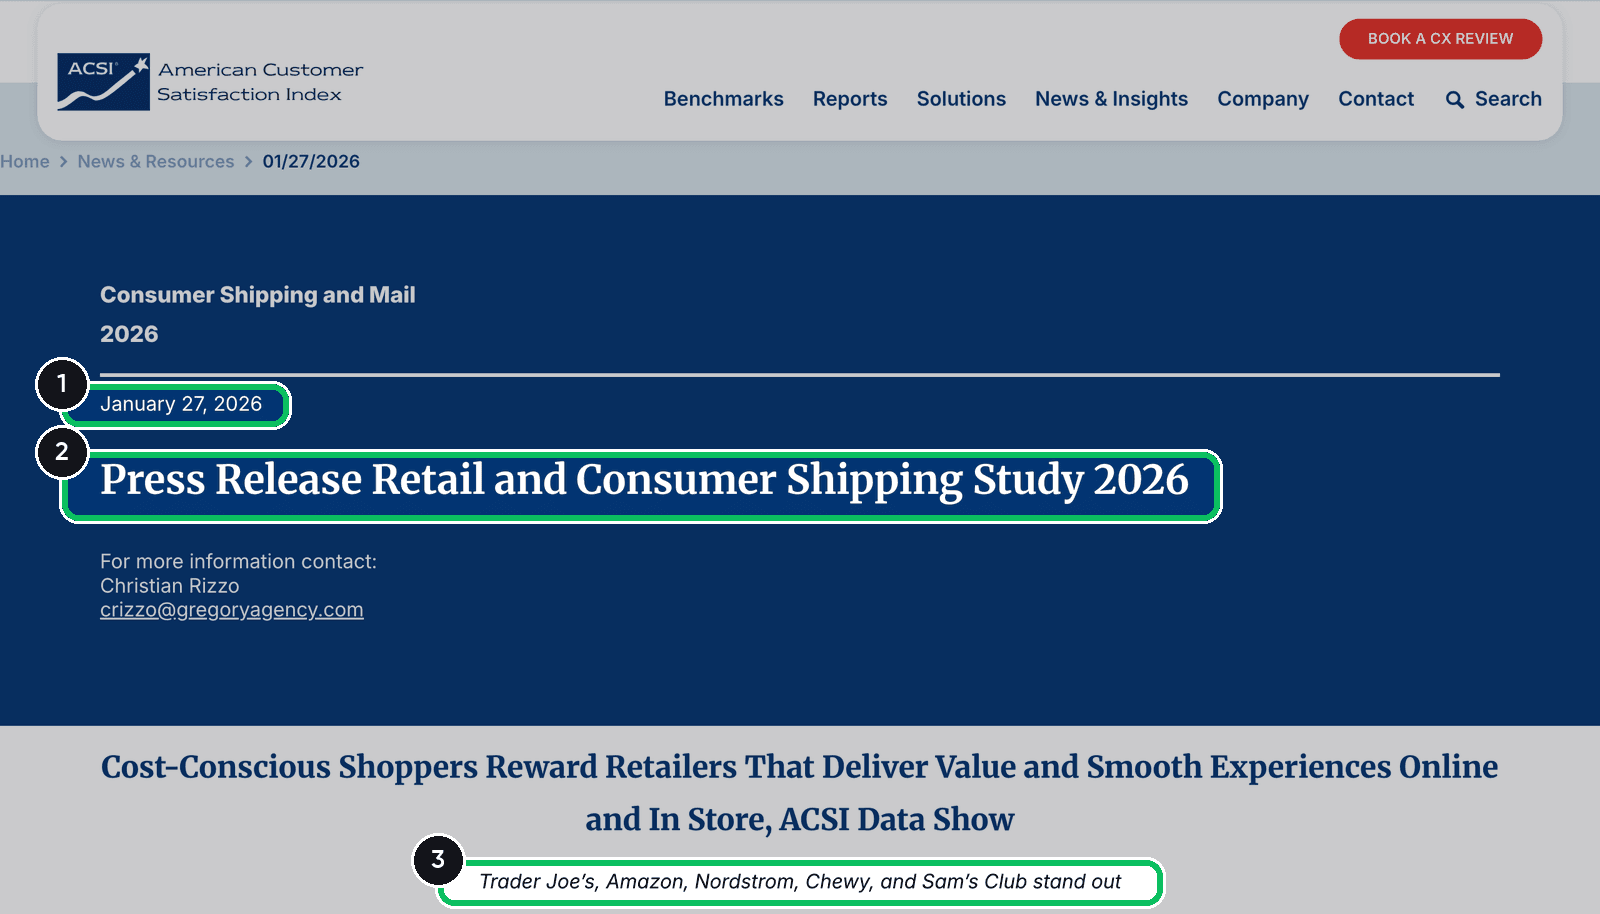
One public reference does exist for satisfaction in US retail: the American Customer Satisfaction Index. In its Retail and Consumer Shipping Study 2026, published on January 27, 2026, online retailers score 79 on a scale of 0 to 100, with Amazon, Nordstrom and Chewy tied for first place at 82. Read it as context, not as a target: ACSI explains that its score is "a weighted average of three survey questions" from its own interviews (ACSI), which is not how the 80% in the example above was calculated.
The comparison that works is with yourself: the same question, sent at the same moment, compared quarter over quarter, with the number of answers written next to the score.
How CSAT and NPS relate to public reviews
A score is private and written for you. A review is public and written for the next shopper. They are connected in four ways.
1. A star rating is an average, not a CSAT. The store in the CSAT example has 80% satisfied customers and an average of 4.2 out of 5. If those 400 answers were public ratings, shoppers would see 4.2 stars, not 80%. Some platforms do not even show a plain average: we explain in a separate article how the Trustpilot TrustScore is calculated.
2. Fewer people write reviews than answer a one-tap survey. A review takes more effort and carries a name. Our review submission rate benchmarks show what share of orders usually turns into a review.
3. A score warns you first. A low CSAT answer a week after delivery reaches you before the customer decides to post anything. Reply within a day. The wording in our guide on responding to negative reviews works in private too.
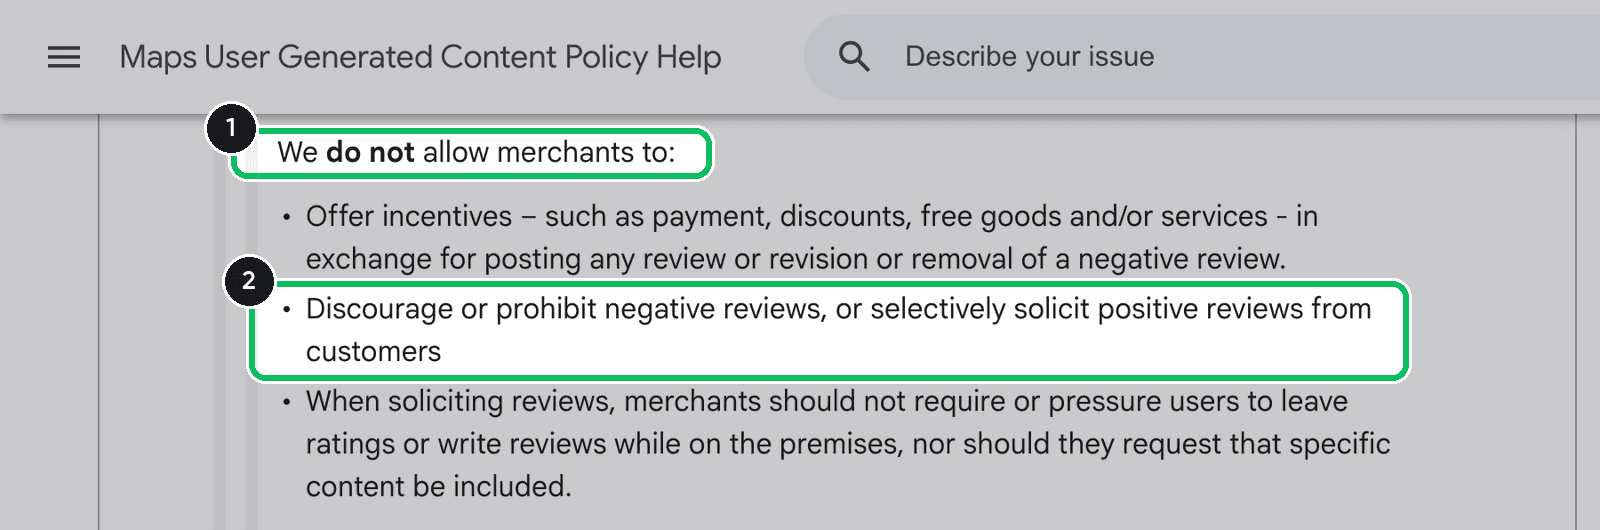
4. The score must not decide who gets a review invitation. Google's Maps user-generated content policy says merchants may not "selectively solicit positive reviews from customers". The FTC, asked whether a business can request reviews only from customers it thinks are happy, answers that the rule on consumer reviews has no specific prohibition, "But this practice could violate the FTC Act." (FTC questions and answers) So survey whoever you like, and invite every customer to review. Our guide on how to ask customers for reviews has the templates.
Here is the Google rule as published.
If you run a Shopify store, the review half of this can be automated. Reviewz is a Shopify app, built by a small team, that asks every customer for a review after an order over WhatsApp, SMS and email. Customers who rate 4 or 5 stars are sent to your public profile on Trustpilot, Google or Judge.me, and the others get a private feedback form your team can answer. Read the invitation rules quoted above for each platform before you switch that routing on. It is free to start, and plans are on the pricing page.
Scores tell you how customers feel. Reviews tell everyone else. Ask every customer over WhatsApp, SMS and email.
Install Reviewz on ShopifyFAQ
What is the difference between CSAT and NPS?
CSAT measures satisfaction with one specific interaction or product, on a 1 to 5 scale, and is reported as the share of customers who answer 4 or 5. NPS measures how likely customers are to recommend the business as a whole, on a 0 to 10 scale, and is the percentage of promoters minus the percentage of detractors.
How do you calculate CSAT?
Divide the number of customers who answered 4 or 5 by the total number of answers and multiply by 100. With 320 satisfied customers out of 400 answers, CSAT is 80%.
How do you calculate NPS?
Count promoters (9 or 10), passives (7 or 8) and detractors (0 to 6). Subtract the percentage of detractors from the percentage of promoters. With 50% promoters and 20% detractors, NPS is 30. The result ranges from -100 to +100.
Is CSAT or NPS better for an online store?
Neither replaces the other. Use CSAT one to two weeks after delivery and after support conversations, because it tells you how a specific order went. Use NPS a few times a year or after a second order, because it tells you whether customers would recommend you.
What is a good NPS score?
Any score above 0 means you have more promoters than detractors. Beyond that, benchmarks vary by source, industry and region, so the most reliable comparison is your own score over time, measured with the same question at the same moment.
What is CES and when should I use it?
CES is the Customer Effort Score. It asks how easy it was to do something, such as placing an order, returning an item or getting help. Use it right after a task, when you want to find friction rather than measure loyalty.
Can I convert a CSAT score into an NPS?
No. The two scores come from different questions on different scales, and NPS subtracts detractors while CSAT only counts satisfied customers. Ask both questions if you need both numbers.

About the author
Nicolas Provost · Founder of Reviewz.ai
Nicolas built Reviewz.ai after auditing 500+ Shopify review setups while running Kanal (WhatsApp marketing for Shopify). He has spent four years inside the Shopify ecosystem and writes about review collection, brand trust SEO, and the actual economics of running customer-feedback flows on ecommerce sites.
